|
Wet Corn Grain And Delayed Harvest
DR. EMERSON NAFZIGER
URBANA, ILL.
According to NASS, 20 percent – or some 2 million acres – of the 2019 Illinois corn crop was still in the field on November 17. Following unprecedented delays in planting, the warm weather in September helped move the crop towards maturity, and frost did not come earlier than normal. So most of the corn in Illinois was at or close to maturity by mid-late October, but temperatures have been below to much-below normal over most of the past month, and this has delayed drydown of the crop. We expect that most of the corn still standing in the field is in the northern third of the state.
One concern with late maturity and harvest of corn is low test weight, which in some cases can mean price dockage at the elevator. Test weight is “bulk density”, or the weight of corn grain per unit of volume, expressed as pounds per bushel (one bushel is 1.24 cubic ft.) The “standard” test weight for corn is 56 pounds per bushel, and this weight (not a volume of 1.24 cubic feet) has become the standard unit for marketing corn grain. Test weight is easily measured, but is not easily understood: it’s a complex characteristic, affected by kernel shape, kernel density, and the slipperiness of seedcoats, which affects how well kernels slide past one another. These are all affected both by genetics and by how the crop grows, matures, and is dried for storage.
There are two main reasons for low test weight. The first is the premature end to kernel filling that can result from poor growing conditions, disease of leaves or ears, severe drought, or frost that comes early or that occurs before late-planted corn is mature. Starch deposition in kernels starts at the crown of the kernel and moving towards the base, and when the movement of sugars into the kernel stops before kernels are full-sized, the base of the kernel may be shrunken. The starch deposited under poor conditions can also be less densely packed on the endosperm. The result can be kernels that don’t weigh as much as usual and that don’t fit together very well, both of which can lower test weight. Such kernels have less starch and a lower starch-to-seedcoat ratio, but they might have higher protein and oil, since these are deposited before starch deposition ends.
The market typically rewards sound, dense kernels, so shrunken kernels may be docked in price, with the amount of dockage tied to test weight. Test weight acts as a proxy for harder-to-measure things such as starch content or kernel density. Kernels that don’t fill completely may also contains sugars that didn’t get converted to starch, and these can darken during heated-air drying, causing additional dockage due to kernel damage. The last time we saw a substantial amount of this was on 2009, when cool weather prolonged the season, and test weights were as low as the mid-40s in some fields.
The other main reason for low test weights is having high grain moisture when test weight is measured. This is complicated – if all other kernel characteristics stay the same as kernels lose moisture, test weight might decrease as kernels dry, due to loss of water weight. The loss of water from kernel starch usually causes starch granules to pack together more tightly, though, which increases kernel density and test weight. Dry kernels tend to slide past one another more easily, so they pack a little better, which can also raise test weight. But as kernel moisture drops into the low teens, it might be possible for kernels to lose test weight as water is lost but nothing else changes much.
We did a small experiment in 2017 to see how test weight responded as kernels dried down. We selected ears from several different trials, with different hybrids and management factors, including planting date, with the goal of starting with grain around 30 percent moisture. Three grain samples were collected from each source, and grain was allowed to dry down in the open air in the lab. At the start and then every few days, samples were stirred, grain moisture was taken using a GAC tester, and test weights were taken using an official (funnel) test weight apparatus. Weights of one-pint volumes of grain were taken using an electronic balance. Testing continued for two to three weeks, and ended once grain moisture dropped to about 12 or 13 percent. Changes in test weight as grain moisture dropped are shown for five grain sources in Figure 1 below.
While responses of test weight to grain drying varied some among sources of samples, trends were fairly consistent. From about 30 percent to about 27-28 percent moisture, test weight tended to drop by a pound or two, presumably as kernel lost moisture (2 percentage points of moisture weighs about 1 pound per bushel) but little else changed. From 25 down to about 15 percent moisture, test weights tended to rise more or less as a straight line. The increase in test weight as moisture dropped from 25 to 15 percent ranged from 5.3 to 7.7 pounds per bushel, and averaged 6.1 pounds per bushel. As moisture dropped below 15 percent, the rate of increase in test weight slowed, but never to zero.
I don’t know if corn grain delivered at, say, 28 percent moisture with a test weight (measured on wet grain) of 53 pounds per bushel is ever docked in price, but if the grain is bright and sound, there may often be some flexibility in assigning dockage amounts, especially if high-test-weight, dried grain is being delivered as well. Our results show that drying the grain (very gently, without heated air or mechanical disturbance) to 15 percent moisture should increase test weight of such grain by at least 5 pounds per bushel. Mechanical handling, such as moving grain through augers, might, by rubbing the kernels, increase the extent to which they fit together, thereby increasing test weight a little more.
To put this into perspective, a 56,000-lb (1,000 “wet” bushels) truckload of grain dried from 25 percent down to 15 percent moisture loses 1-75/85 = 11.8 percent of its weight as water, so ends up as 882 bushels of dry corn. There is also some mechanical weight loss during drying – for example the “wings” that scatter from driers – but that’s typically only a fraction of a percent. If the test weight at 25 percent moisture is 53 lb/bu, that amount of grain would occupy 1,310 cubic feet, or 1,056 bushels, of bin space. If after drying the test weight is 57 lb/bushel, this grain would occupy only 1,075 cubic feet, or 867 bushels of bin volume. The fact that weight drops by 11.8 percent while the grain volume drops by 18 percent shows that about two-thirds of the decrease in volume is due to weight loss and about one-third is due to increase in test weight.
The price of corn and cost of drying means that some may choose to allow the corn to stay in the field for some time before they harvest it. If the crop is still standing well after some wind events we had over the past six weeks, and if ears remain firmly attached, then there may be little danger that harvest losses will increase quickly. Temperatures are expected to be somewhat higher over the next week or so than they have been in recent weeks, and this should help. But high temperatures in the 40s are not going to bring rapid drydown, and it could easily take a week to lose a point of moisture, although sunshine and some wind might increase this rate. We’ve all heard of corn staying out until February or March and being harvested safely with good quality. While that might mean no direct storage costs, we need to count as “storage” costs any grain that ends up on the ground and not in the bin once we do harvest it. ∆
DR. EMERSON NAFZIGER: Research Education Center Coordinator, Professor, University of Illinois
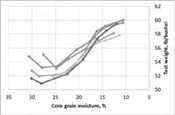
Figure 1. Changes in grain moisture and test weight measured on grain samples air-dried indoors.
|
|