|
Evaluating Corn Stands For Possible Replant

GREGORY A. LUCE, DR. KEVIN BRADLEY AND DR. WILLIAM J. WIEBOLD
COLUMBIA, MO.
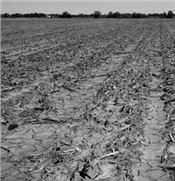
The 2019 planting season has been one of the most challenging, yet growers have dealt with similar situations and they are remarkably working their way through this one. There are some very good corn stands, while others have considerably lower than target populations. Replant decisions can be easy in worst cases, with little stand and huge bare areas. However, there are fields where it is very tough to decide whether or not to replant. Those fields require some extra attention and this article is meant to help with those field evaluations.
It is important to make the decision based on economics and not emotion. It is also important to be patient in waiting for soil conditions to be satisfactory. While this is easier said than done, jumping into the field when it is not ready can cause problems that are not easily corrected.
Conduct stand counts and utilize replant decision guides to decide whether to keep the existing stand. Make sure you know the cause of the poor stand. This season the cause may be obvious, but knowing all factors is important information to avoid further problems.
Utilize Decision Guides
Refer to MU guide 4091 from Dr. Bill Wiebold and Dr. Ray Massey: “Corn and Soybean Replant Decisions” at the following link: http://extension.missouri.edu/p/G4091
This MU Extension guide will help you work through the costs associated with replanting and aid your decision whether or not to replant. There are definitely regional differences and they are referenced in the guide for North & Central Missouri and for Southeast & Southwest Missouri.
Considering the later time frame we are in now, it is important to evaluate stands based on the yield potential of the existing stand, and the yield potential that is expected at the possible replant date. Using the data Dr. Wiebold has collected from central Missouri, the following tables demonstrate the yield percentage expected by planting date and population. There are two charts below, one that represents moderate yields and another for typically high yielding fields.
Using this chart, a population of 18,000 plants/acre that was planted May 6th has a higher yield potential (76 percent) than that expected if replanting Jun 5th and getting a full stand of 30,000 plants/acre (75 percent).
In making decisions in a high yield environment there is certainly a need for a higher population. Irrigation adds to the stability and yield potential. An example in using the chart for high yield environments would be: a stand of only 24,000 plants/acre planted by May 1st would have better yield potential (82 percent), than replanting on May 31st and obtaining a full stand (77 percent).
Given the fact that; the later we get, the more acceptable the corn stand becomes; you may find it better to be planting soybean than replanting corn. Consider the numbers in the above charts to help you make those determinations.
Do's and Don'ts in Making Corn Replant Decisions
Do
• Evaluate stands by using Replant Decision Guides such as G4091
• Keep emotions in check and base decision on economics
• Consider the health of the existing plants
• Kill out the previous stand if replanting
If corn is to be chemically killed, refer to the following IPCM Article link from Dr. Kevin Bradley titled: Herbicide Options for Killing Failed Corn Stands
Don't
• Fill a corn stand in by planting more down the same row
• Forget to consider all the costs associated with replanting
• Hesitate to ask for help! Your Local Extension Agronomist and seed company professionals can help you make replant decisions. ∆
GREGORY A. LUCE: Adjunct Instructor, Division of Plant Sciences, University of Missouri
DR. KEVIN BRADLEY: Associate Professor, University of Missouri
DR. WILLIAM J. WIEBOLD: Professor Plant Sciences, University of Missouri
Moderate Yield Environments
Represents Average Upland & Non-Irrigated Fields
Yield as percent expected
14,000 18,000 22,000 26,000 30,000
May 1 69 78 86 92 94
May 6 67 76 85 90 92
May 11 65 74 82 87 89
May 16 63 71 79 84 86
May 21 61 69 76 81 83
May 26 58 66 74 78 80
May 31 56 64 71 75 77
Jun 5 55 62 69 74 75
Jun 10 52 59 65 70 71
Jun 15 47 54 60 64 65
Using this chart, a population of 18,000 plants/acre that was planted May 6th has a higher yield potential (76%) than that expected if replanting Jun 5th and getting a full stand of 30,000 plants/acre (75%).
High Yield Environments - Consistently over 190 bu/a Average
Represents High Yield Upland & Bottoms; and Irrigated Fields
Yield as percent expected
16,000 20,000 24,000 28,000 32,000 36,000
May 1 63 72 82 87 92 94
May 6 62 71 80 86 90 92
May 11 60 69 77 83 87 89
May 16 58 66 75 80 84 86
May 21 56 64 72 77 81 83
May 26 54 62 70 74 78 80
May 31 52 59 67 72 75 77
Jun 5 50 58 65 70 74 75
Jun 10 48 55 62 66 70 71
Jun 15 44 50 57 60 64 65
In making decisions in a high yield environment there is certainly a need for a higher population. Irrigation adds to the stability and yield potential. An example in using the chart for high yield environments would be: a stand of only 24,000 plants/acre planted by May 1st would have better yield potential (82%), than replanting on May 31st and obtaining a full stand (77%).
|
|