|
Net Revenue For Soybeans Beats Corn

Continuing our look at the profitability of major row crops in the US, we turn to soybeans this week. The relative profitability of the major crops produced in the US has some effect on the planting decisions that farmers are making at this time of year, though attention to crop rotations and spring weather are also taken into consideration.
As we did with corn in the previous column, we are using the “Commodity Costs and Returns” numbers that are provided by the Economic Research Service (ERS) of the United Stated Department of Agriculture (USDA) (https://tinyurl.com/j2pxesv). The tables we will be using are those released in October 2017 and are the first estimates available after the end of the 2016 crop marketing year for the dominant crops grown in the US.
Soybeans are the second most widely grown crop on US farms and are generally grown in rotation with corn or other crops. Because of disease issues, soybeans are typically not planted back on the same ground in successive years.
In response to growing international demand for soybeans, primarily from China, and relative profitability when compared to other crops, over the last decade soybean planted acreage has increased by 14.4 million acres to 90.1 million acres in 2017. Harvested acres have followed closely increasing by 14.8 million acres to 89.5 million acres. The difference between planted and harvested acreage reflects production problems on a relatively small number of acres.
The 2016 US soybean harvest was a record 52 bushels per planted acre, 4 bushels higher than the previous year. The season average price paid to farmers was $9.47 per bushel, $0.52 above the price a year earlier, but well below the $14.21 season average price during the 2012 crop marketing year.
With year-on-year increases in both yield and price, the gross value of production per planted acre increased by $61.56 per acre to $469.56.
Farmers were able to decrease their operating costs by $8.33 per acre with a reduction of $5.48 in fertilizer costs making the largest contribution to lower costs. Other items contributing to lower costs were fuel, lube, and electricity at $1.93; seed at $1.81; and repairs at $0.13 per planted acre.
Increased operating costs were seen in chemicals, $0.66; interest on operating capital, $0.34; and custom operations, $0.12 per planted acre. The cost of purchased irrigation water remained the same between the 2015 and 2016 crop years.
A year-on-year reduction of $14.78 in the opportunity cost of land per planted acre led the cost reductions in allocated overhead followed by a decline of $0.07 in taxes and insurance. The allocated overhead categories of the opportunity cost of unpaid labor (the farmer) and capital recovery of machinery and equipment increased by $0.51 and $0.33 per planted acre, respectively. There was no change in the cost of hired labor and general farm overhead between the two years, 2015 and 2016.
The result of reductions in both operating costs and allocated costs resulted in a reduction of total costs of $22.34 to $452.85 per planted acre.
The decrease in total costs and the increase in revenue per planted soybean acre resulted in a change in net revenue from -$69.19 in the 2015 crop year to $16.71 in 2016, a positive change of $83.90 per planted acre.
Using the calculated soybean forecast yield per planted acre and the midpoint of the 2017 season average price forecast, farmers can expect $453.59 in revenue per planted acre which is less than $1.00 net revenue above 2016 costs. To keep their head above water, farmers will have to keep a tight control on soybean production expenses in the coming year.
Compared to continued losses in corn production it is very likely that increases in the acreage devoted to soybean production will continue. ∆
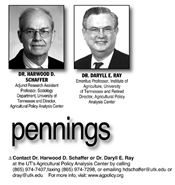
DR. HARWOOD D. SCHAFFER: Adjunct Research Assistant Professor, Sociology Department, University of Tennessee and Director, Agricultural Policy Analysis Center
DR. DARYLL E. RAY: Emeritus Professor, Institute of Agriculture, University of Tennessee and Retired Director, Agricultural Policy Analysis Center
|
|