|
Update On Soil Nitrogen
DR. EMERSON NAFZIGER
URBANA, ILL.
Corn planting has moved ahead of the 5-year average, with 66 percent of the Illinois crop planted by May 1. Early planting usually means an early start to nitrogen uptake. But N uptake is slow for a month or more after planting: in one study we did in 2015, plants at the 4-leaf stage about five weeks after planting had only 4 pounds of N per acre in the above-ground part of the plant. So there’s time both to get N applied to the crop before it needs it and also time for N in the soil to move out of the rooting zone if it’s in the nitrate form and the weather turns wet.
Soil N after fall N application
Dan Schaefer of IFCA and we have continued to sample soils this spring to see how much N applied as anhydrous ammonia last November remains in the top 2 feet of soil, and how much of this N is still in the ammonium form, hence safe from loss even under wet conditions.
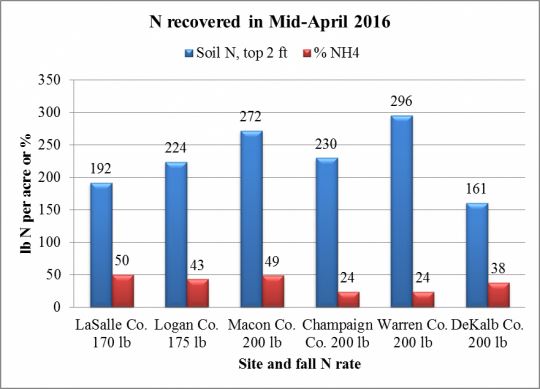
Figure 1 shows soil N recovered from samples taken in mid-April. Fall ammonia applications were made in November at the N rates shown, and all included N-Serve. The three sites on the left are farmer fields, and the three on the right are U of I research centers. At the Logan county site, soil without N fertilizer had 84 lb. of N recovered, and zero-N plots had 64, 48, and 63 lb. N recovered at the Champaign, Warren, and DeKalb County sites, respectively.
Even after subtracting an amount of N in soils without fertilizer, most or all of the N applied as fertilizer last fall was recovered in mid-April sampling. For the three on-farm sites, about half of the recovered N was in ammonium form. The amount of N recovered from three on-farm sites with similar soils in April 2015 was similar to what we found this year, but last spring only about one-third of the recovered N was in the ammonium form. Given the difference between the two winters it’s surprising that more of the N was in the ammonium form this year, but we can take it as good news.
With the exception of DeKalb, amounts of nitrogen recovered at the research center sites were also close to the amount of N applied last fall, and were similar to amounts of N recovered from samples taken in April 2015 at the same sites. The positive from sampling at all six sites is that, after a lot of concern about N loss following warm and sometimes-wet condition this past winter, we aren’t really finding that a lot of the N has been lost. Reports are also that surface water nitrate levels, which were higher than normal in February, have not continued to increase, probably because rainfall and tile flow haven’t been unusually high.
In contrast to what we saw in the on-farm sites this spring, only about one-fourth of the N recovered was in the ammonium form at the research centers, compared to nearly half in the ammonium form in last year’s samples. We don’t have an explanation for the difference between on-farm and research center sites. But unless we get a lot of rainfall, N present as nitrate will remain a ready source of N for the crop.
More unexpected than the high percentage of nitrate we found is the fact that we found so much more N at research center sites in April than we found in February. On April 8 I reported http://bulletin.ipm.illinois.edu/?p=3554 that samples taken from these plots in late February this year showed only about 130 and 160 lb. of N per acre, with about 60 and 43 percent of the recovered N in the NH4 form at Urbana and Monmouth, respectively. The amount of ammonium-N we recovered changed very little between February and April, dropping from 78 to 60 lb. at Urbana and from 68 to 67 lb. at Monmouth. So the higher amount of soil N we found in April came entirely from the increases in nitrate. I’m at a loss to explain how soil nitrate could increase by 116 and 146 lb. per acre at the two sites over a period of 6 to 8 weeks, with little or no drop in ammonium levels. So I won’t speculate; we can just accept that the N is in the soil and available as the growing season gets underway.
Nitrification inhibitor
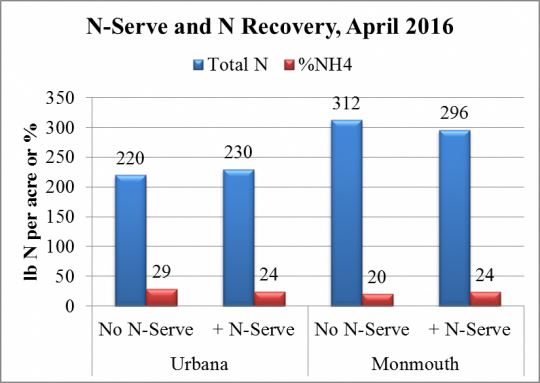
In the April 8 Bulletin article cited above I reported that N-Serve® used with fall-applied NH3 had little effect on the amount of soil N or ammonium recovered in February at the Urbana and Monmouth sites. Figure 2 shows the amount of soil N recovered and the percentage of N found as ammonium in the mid-April samples. As we saw in February, adding the inhibitor in the fall gave no consistent effect on either N recovery or the percentage of N as ammonium. That’s not surprising, as the levels of ammonium were already fairly low in February and so there wasn’t much ammonium present to nitrify. We had these two treatments at several other sites, and will report on those results later.
Cover crop rye and soil N
Using cereal rye to take up soil N and thereby lower potential for loss is becoming more common. Some are using the cover crop to scavenge residual N following harvest in the fall, and some are planting rye before fall N application, or in some cases even fertilizing the cover crop when it’s planted, to see if this will increase the total amount of N recovered in the spring.
Dennis Bowman, UI Extension educator and Dan Schaefer are managing a cover crop study at the U of I research center near Urbana in which cover crop rye was drilled after harvest of both corn and soybean last fall. These trials received no addition of N before soil and cover crop samples were taken on April 15, 2016 and analyzed for N. The rye was 12 to 18 inches tall at the time of sampling, and its dry weight was 942 lb. per acre following corn and 1,735 lb. per acre following soybean.
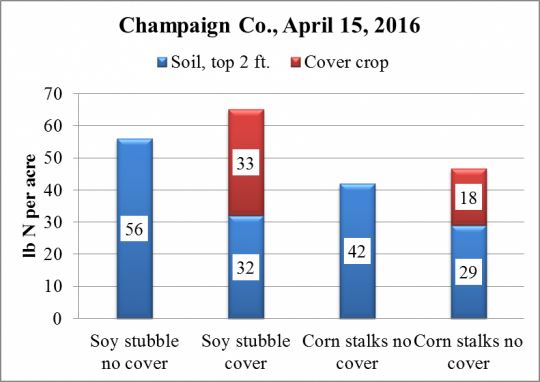
With no fertilizer N added, the amount of soil N recovered in mid-April was low – only 56 lb. per acre following soybean and 42 lb. following corn (Figure 3). When the cover crop was present, the amount of N recovered from the soil plus the cover crop rye following corn and soybean was only 9 and 5 lb. per acre higher, respectively, than the amount recovered from the soil without cover crop. The cover crop contained about half of the recovered N following soybean and less than 40 percent of the N recovered following corn. In both cases the amount of N left in the soil with cover crops present was only about 30 lb. per acre, which is about as low as soil N levels ever get. So the cover crop took up what N it found, but that was not very much. The cover crop residue contained less than 2 percent N, or less than half that of a well-fertilized cereal rye crop at the same stage. Its C:N ratio was above 20, reflecting this N deficiency.
Dan Schaefer is also managing an on-farm site in Macon County in which fall ammonia was applied at the rate of 175 lb. N with N-Serve. The site was soybeans in 2015, with one field planted to cover crop rye and an adjoining field without cover crop. Soil and cover crop samples were taken on April 8, 2016 and analyzed for N. With the added N, rye growth was excellent, with more than 2,700 lb. of dry weight per acre.
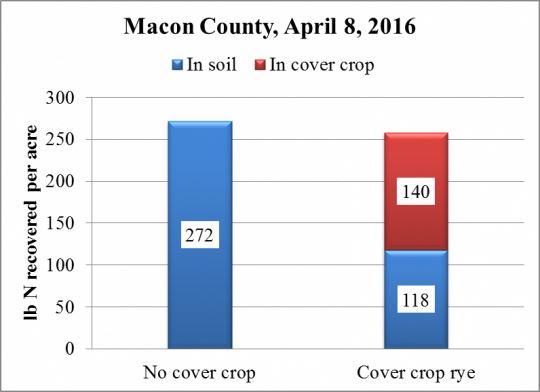
Nitrogen recovery was very high, with 272 lb. of soil N recovered per acre without a cover crop (Figure 4). Of this amount, 132 lb. per acre (49 percent) was in the ammonium form. In the field with cover crop rye, a total of 258 lb. N per acre was recovered, slightly less than the amount recovered without cover crop. Of this total, 140 lb., (54 percent) was in the cover crop, and 128 lb. was in the soil. Of the amount of N in the soil under cover crop, 116 lb. (84 percent) was ammonium, indicating that the cover crop took up nitrate as it was formed, leaving relatively little in the soil. The cover crop might have taken up some ammonium, but soil under cover crop had only 16 lb. less ammonium-N than soil without cover crop, so ammonium uptake by the rye was minimal.
While having rye take up most of the fall-applied N would seem like a good way to lock in the N and keep it from being lost, this also means that much of the N ends up in a form that will become only slowly available to the corn crop. In early April, the field with cover crop had only 128 lb. of plant-available N, and while this amount may increase some after the cover crop is killed due to mineralization, this soil now has nowhere near as much N as the corn crop will need.
How much of the cover crop’s N will become available to the crop, and when this happens, involves weather, soils, and crop growth, so is highly unpredictable. Some of the N in dead cover crop tissue may still be inorganic (nitrate or ammonium) and this can get into the soil and reach the corn roots relatively quickly. But most of the N is part of proteins and amino acids, and getting it into the soil and to the roots requires microbial activity, with N being released as microbes grow and die off. The cover crop residue in this case had a C:N ratio of only about 10:1, so tieup of N should be minimal as the residue starts to break down. Still, the process by which N cycles through microbes to get to the crop’s roots is neither fast nor complete, and the chances that all of the N will all get to this year’s corn crop in time are not high.
Whether or not fall N was applied, fields with cover crop rye going into corn this spring are likely to have low amounts of N in the seeding zone due to uptake by the rye. Strip-till done in the fall or in the spring reduces the density of rye roots in the planting strip, so should lessen this problem. If corn seed will go into soil close to residue or roots of rye, it may help to add some N in-furrow or close enough to the seed to allow the seedling access to the N soon after emergence. That should help avoid early N deficiency. But if the rye has made a lot of growth, it may be worth considering sampling to measure soil N at sidedress time to see if the supply is adequate, even if enough N was applied last fall.
The work reported here is supported by the Illinois Nutrient Research & Education Council, which administers funds from the Illinois fertilizer checkoff. This support is gratefully acknowledged. ∆
DR. EMERSON NAFZIGER: Research Education Center Coordinator, Professor, University of Illinois

Figure 1. Plant-available nitrogen (ammonium plus nitrate) in the top 2 feet of soil from samples taken
at six Illinois sites in mid-April, 2016. Fall N was applied in November 2015 as NH3 at the rate indicated
for each site, and included N-Serve®.

Figure 2. Soil N recovery in mid-April 2016 following application
of 200 lb. N per acre as NH3 with and without N-Serve in November 2015.

Figure 3. Recovery of nitrogen at a Champaign County site on April 15, 2016 with and
without cover crop rye drilled into corn and soybean crops after harvest in fall 2015.
No fertilizer N was applied in these trials.

Figure 4. Recovery of soil and cover crop nitrogen on April 8, 2016, at a Macon County site
with and without cover crop rye and with 175 lb. N as ammonia with N-Serve applied in November, 2015.
|
|