|
Heat Units: Thermal Time
DR. JOE HENGGELER
PORTAGEVILLE, MO.
When one really wants the skinny on something, he should make inquiries to someone in a group for which that item plays a crucial part in their lives. For example, to most of us snow is, well … snow. However, it is said that the Eskimos have 50 different words or word phrases for snow. Exactly who are the Eskimos of Heat Units? There are two groups.
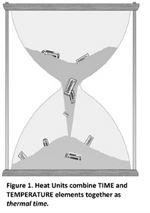
But, first, what are Heat Units (HUs)? The HU is a concept that combines two things: time and temperature. As such, HUs are sometimes referred to as thermal time. In some circles HUs are called growing degree-days (GDDs). DD50s is a specific form of HU that uses 50°F as its base, and is often used in rice growth models. HUs have a long history and have been in use by agriculturalists since before our country was ever founded. The reason scientists use HUs is that they better predict physiological events in the plant world then time alone does. Case in point is this last spring’s Charleston Dogwood-Azalea Festival, which usually takes place the third weekend in April when both species are normally in full bloom in that Missouri hamlet located near the Mississippi River. However, with this year’s cold spring (i.e., fewer HUs), the azaleas were not yet in peak bloom at the time of the festival. In contrast, the year before had a very warm spring and festival organizers that year were afraid that peak bloom would have run its course by the time the tourists arrived. Plants do have calendars, but they are thermal ones.

The HUs for a day are calculated by averaging the day’s maximum temperature (Tmax) and minimum temperature (Tmin) from which is subtracted a base temperature (Tbase) value (for example, the base temperature commonly used for rice is 50°F). Daily HU values are summed up into accumulative HUs from a set point (from Jan 1, from planting, from last moth flight, etc.). There are many different formulations to calculate HUs: the base temperature being used, using caps on Tmax and Tmin, etc.
So, back to our question, who are the HU aficionados? First, dairy farmers who grow their own silage would be one group. Obviously, the more silage cut the better, and so it is beneficial to allow corn to keep growing, gathering more bio-mass before being green-chopped. However, towards the end of the season as this bio-mass accumulates, its nutrient value begins to decline. There is a happy point where the rates of biomass accumulation and nutrient decline produce the most efficient silage. Also, into this mix, moisture content plays a role. Silage growers have learned that by counting HUs they can estimate the point that ties biomass, nutrient, and moisture together at the optimum conflagration for quality silage.
The second group of HU Eskimos is the corn growers (both grain and silage) who farm in the northern reaches of the Corn Belt, specifically our good neighbors to the north, the Canadians. In this region they are pushing the envelope for growing corn, a plant native to southern Mexico. How late can corn be planted for various Relative Maturity lengths yet still reach maturity? what are the probabilities involved? All pivotal questions involved in corn production up north. Besides producing great hockey players, Canada also produces great (and practical) scientists. In order to develop the concept of HUs into a more precise tool, they have finely parsed HU calculation into a method they call Crop Heat Units (CHU). Developed in the 1960s, the unit was first called Ontario Heat Units. It is significant in that it uses two equations to calculate the HUs in a 24-hour day. One equation looks at daytime HUs and employs Tmax. A separate equation is used for nighttime HUs, and uses Tmin values. The results from both equations are then combined together as the daily CHU value. Additionally, in efforts to even better predict important corn physiological stages, Canadian researchers have a pre- and a post-silking method of counting HUs! However, Canadians still do use the traditional single-equation calculation for HUs, which they refer to as GDDs. If may sound confusing, but there are a host of excellent provincial and national websites available to assist Canadian farmers in this matter.
Corn Heat Units
The standard heat unit calculation for corn used today is based on the 1956 research of Gilmore and Rogers of Texas A&M University. They looked at 15 different methods of calculating HUs and determined how well they predicted the date of silking for various varieties of corn planted on five different dates. Their test recommendations, later to become the de facto method used by seed companies, were these:
• Tbase = 50
• If Tmax was > 86, then Tmax = 86.
• if Tmin < 50, then Tmin = 50.
Cardinal Temperatures
The reason that the Texas authors used 86°/50° as one of their test parameters employed in their study goes back to early 1914 Illinois research on the cardinal temperature values for corn seedling growth done by a man named Lehenbauer. Lehenbauer, born in Missouri, later became a professor and department head of the Horticulture Department of the University of Nevada. Prior to that, he worked at the University of Illinois. One of his publications while in Illinois was on carnations and a fungus that was attacking them; he made notes on the optimum temperatures both flower and the fungus thrived in. Since he was working in greenhouses, Professor Lehenbauer could control the temperature of his plants and evaluated its effects on plants. It was while he was still at Illinois University that he wrote his famous paper, Growth of maize seedlings in relation to temperature, still commonly cited today, almost 100 years later.
Cardinal temperatures are the three significant temperature values involved in the rate of growth or change in a biological activity of cold-blooded life forms (e.g., germination, leaf expansion, stem elongation, protein formation, fungus growth, insect emergence, etc.). In order of the lowest to the highest cardinal temperature value, the smallest (minimum T) is the temperature at which the measured biological activity (e.g., growth, leaf initiation, germination, mold growth, etc.) shuts down due cold; the next value (optimum T) is the temperature associated with the highest rate of biological activity; the last one (maximum T) is the temperature at which the biological activity stops, this time due to being too hot1. Lehenbauer showed that corn seedling growth was the greatest at 86°, whereas growth was reduced by 95 percent at 50°, while on the other end seedlings stopped growing at 110°.
Interestingly, the results from Gilmore and Rogers’ landmark study showed that 86°/50° of daily maximum and minimum temperature values was actually NOT the best predictor for corn growth. The study had included treatments using three-hour average temperatures (8 temperature values each day). In these three-hour sets, it was again 86°/50° which proved the best predictor. However, in a wise move they did not promote the use of the three-hour temperature values because this type of data was not readily accessible to farmers back then.
The Gilmore and Rogers work illustrates the fact that the accuracy of Heat Unit models generally improve as the time step is shortened – thus hourly temperatures are better for prediction than are daily values. Realizing that shorter is better, yet cognizant of the fact that only the max/min values are, even today, readily available, scientists have employed things like the math of sine curves to mimic the diurnal pattern of temperatures during a normal day as a roundabout way to better mimic hourly values. Others also used the concepts of geometry and, based on whether the current day’s minimum was larger than, smaller than, or equal to yesterday’s minimum, predicted hourly values.
Optima
A dimensionless form of HUs is sometimes employed by researchers. Back in the day, in lieu of either the term Heat Unit or Growing Degree Days, both Lehenbauer and Gilmore/Rogers had originally proposed using the term optima in their calculations (which ironically was the same term I had used in my papers prior to delving into their work). Optima models work well when hourly temperature values are available. The maximum value for daily optima is 1.0; for corn this would occur only if the temperature had stayed at 86°F all day. However, during the course of the day temperatures do change. For those hours of the day when temperature values are > 110°F or < 45°F, the hourly optima value for those hours is 0.0. For all other hours, the optima value is calculated on a sliding scale based on how far off the temperature is from the optimum temperature of 86°F. As an example, the average daily optima for May in Portageville, MO is 0.59.
Optima models generally involve another parameter: potential accomplishment rate. Recall that Lehenbauer was studying corn seedling growth rates. Assuming that for corn it is 1.5 inches per day. Then during May the height should expand 0.59 x 31 days x 1.5 ipd ≈ 27 inches.
The Use of optima in models should come with the label “don’t try this at home” clearly pasted on it. However, for the modeler optima are excellent tools, and are very accurate in predicting growth stages. In terms of accuracy: optima > HUs > calendar days. Another benefit in using optimas is that models can readily be adjusted for differences in hybrids, locales, etc. For example, if it turned out from field verification that the change in height was 24 inches, not 27, then the potential accomplishment rate should be 1.3 ipd (24/27 * 1.5).
While I am a firm believer in employing optimas, it should be something done internally (and invisible) in irrigation scheduling and other models. Crop specific Heat Units should have top billing.
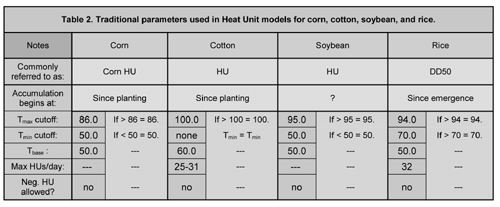
Making It All Usable
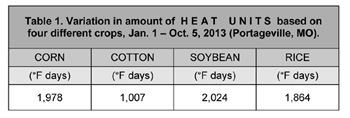
Heat Units are a wonderful tool when applied correctly. The first step in making HUs a practical tool is to define how the calculations are to be made. For example, is there to be a Tmax value, and what is it? Is there a Tmin value, and what is it? One over-looked difference in HU calculations occurs when using Tmin values. For corn HUs, temperatures lower than Tmin are increased upwards, whereas, with rice temperatures HUs higher than Tmin are decreased downwards. For cotton HUs there is no Tmin value at all! Due to the fact that they are calculated differently, the amount of HUs in a given timeframe differs by what method is employed. Generally, the order (numerically from top to bottom) is: Soybean HUs > Corn HUs ≈ Rice HUs > Cotton HUs. Table 1 shows the year-to-date HUs on October 5 for Portageville, MO this year. If HUs are reported in °Celsius, those HU values, as well as, the accumulative HU amounts are 5/9ths of the °F sums, thus in SI units the accumulative corn HU amount year-to-date for Portageville is 1,789 °C days.

Although there is a general agreement on the calculating procedures to be employed for each crop, some small discrepancies still do exist among users. For example in cotton, some states top Tmax at 100 °F, others at 95°F, while the majority have no top at all for Tmax. In actuality this is a “much ado about nothing” situation. For the scorching year of 2012, no top on Tmax resulted in 3134 HUs, the 100°F method had 3129 HUs, while the 95°F followed closely with 3102 HUs (the 95°F cut-off was 99.0 percent of the no cutoff method). Also, over the last 13 years, the annual cotton HU values using a 95°F cut-off has been 99.6 percent of the no cutoff method.
Some states do not track soybean HUs, and instead use the corn HU methodology. Table 2 capsulizes the generally accepted parameters used for calculating crop specific heat units. It is important that educators and researchers use the accepted methodology – or if not, clearly state the procedure used in their model. For example, not using the 86°F cap on corn Heat Units in 2012 would have resulted in significant yield loss due to terminating irrigation 15 percent too soon! Unfortunately, many researchers are too enamored with the “R2” value of their own research (high R2 values equates to better fit between data sets and might make their paper more publishable), so end up tweaking Tmax and/or Tmin values in their heat unit methodology to increase the R2 values in their papers. Doing so is fine, as long as the paper clearly states that a different calculation method was employed.

Relative Maturity (RM) in Corn
The vulnerability of corn growers in the northern portions of the Corn Belt to dangers of early fall frost, led Minnesota legislators to enact a law in 1939 stating that any corn sold within the state would be classified using the Minnesota relative maturity (MRM) rating. This method protects farmers by letting them know that a particular corn will reach its maturity within three days of its labeled RM classification. MRM ratings are totally temporal and do not directly employ HUs per se, other than the fact that the HUs of a region drive the time it takes a hybrid’s kernels to reach certain moisture levels and to reach black layer. For this reason, the state was divided into five east-west zones. The Minnesota Agricultural Experiment Station actually conducts comparative trials throughout these zones to come up with regionalized RM values for the various hybrids sold in state. Results from these trials allow them to categorize hybrids into three RM groups – full-season, mid-season, and short-season.
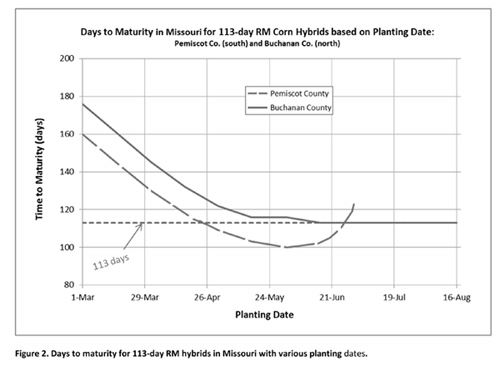
The RM system is commonly used by seed dealers in Missouri and other states. It does a good job contrasting the relative season lengths between corn hybrids, but as before, location must be considered. Note that the RM rating does not guarantee that the hybrid will mature in that RM timeframe. For example, a 113-day RM hybrid planted in south Missouri (Pemiscot County) within a window between mid-March and mid-May could have a season length ranging from 105 to 150 days, depending on exactly when, in that timeframe, planting occurred. Historically, if one planted a 113-day RM variety on April 24, it would actually mature in 113 days. Before that date, it would take more days; after that date it would take less. However, if planting occurs after June 1, the days until actual maturity begins to increase since HU accumulation slows down once daytime temperatures begin going above 86°F.

It seems a logical strategy to attempt to reduce seasonal corn water requirements by planting early, thus avoiding the season’s heat. However, this does not always pan out for, although daily water use rates are smaller, you can see that the season is longer. Expected rainfall for the periods in question is a significant factor that needs to be brought into the mix in determining irrigation requirements.
Temperature drives most processes in the botanical world. Models that use temperature can allow us to be better managers; however, remember to always use the right methodology for the model and crop you are interested in.∆
DR. JOE HENGGELER: State Extension Irrigation Engineer, Commercial Agricultural Program, University of Missouri
1Sometimes two additional cardinal temperature values are reported, those being the high and low temperatures at which the plant is killed.
|
|