|
As Goes China, As Goes Today’s Soybean Exports

On a volumetric basis, soybean exports have been the bright spot in an otherwise dismal export picture for grains and oilseeds. Corn exports peaked at 2.402 billion bushels in the 1979 crop year, exceeding that level only once – 2.437 billion bushels in 2007 – in the next 34 years. US corn exports fell below the 2 billion bushel mark in 26 of those 34 years. The current estimate for 2013 crop year corn exports is 1.6 billion bushels.
The peak for wheat exports occurred in 1981, with 1.8 billion bushels leaving US ports. In the years since then, wheat exports fell below 1 billion bushels 7 times. Wheat exports are currently estimated to be just less than 1.2 billion bushels for the 2013 crop year – ⅔ of their 1981 level.
The exports for sorghum, barley and rice are far smaller than corn, wheat and soybeans and only rice has seen an increase.
Soybeans exports, on the other hand, have experienced a dramatic increase over the years since 1979. In that year, soybean exports were 23.8 MMT (million metric tons), increasing to an estimated 41.0 MMT for the 2013 crop year. For soybean meal, the increase over that period was from 7.2 MMT to 9.9 MMT. Soybean oil saw a decline in exports from 1.2 MMT to 0.7 MMT over the same period of time.
Taken together soybean complex – soybeans plus soybean meal plus soybean oil – exports totaled 32.2 MMT in 1979, increasing to an estimated 51.6 MMT for the 2013 crop. The increase in US soybean complex exports is an important story, but we would be remiss if we didn’t look at the world import picture as well.
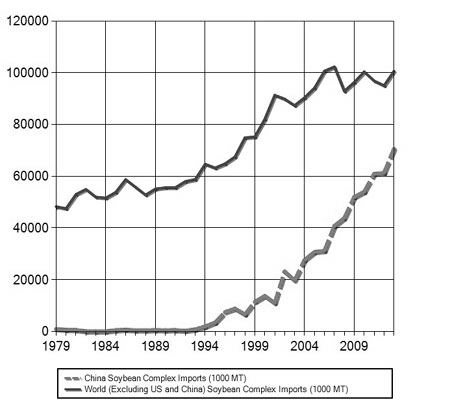
China’s imports of soybeans have been a significant factor in the increase in US soybean exports, while Brazil and Argentina have also benefitted. The importing of soybeans by China has increased from 0.8 MMT in 1979 to a currently estimated 69 MMT for the 2013 crop year. Since 2000, China’s soybean imports have increased by nearly 4.3 MMT a year. Imports of soybean meal and soybean oil by China are relatively small over the whole period. China is now the largest importer of soybean complex in the world at 70.1 MMT.
If we look at the imports of soybean complex by all of the countries in the world, excluding the US and China, we see an important picture. In 1979 these countries imported 48.2 MMT of soybean complex. For the 2013 crop year, it is estimated that these countries will import 100.6 MMT of soybean complex. Since 2000, these imports have increased by 1.4 MMT per year, a rate far below that of China.
As seen in figure 1, since 2006 the importing of soybean complex by countries other than China has been on a plateau. A multi-year hiccup by the world’s largest buyer, China, could create serious problems for soybean farmers in the US and South America. None of us knows what the future will bring in the world trade of soybean complex, but at this point in time the prosperity of millions of soybean farmers is very dependent upon one finicky customer (ask US corn farmers how finicky China can be).∆

Figure 1. A comparison of China’s soybean complex imports with those of all the countries in the world
excluding the US and China, 1979-2013. Data source: USDA, PS&D.
DR. DARYLL E. RAY: Blasingame Chair of Excellence in Agricultural Policy, Institute of Agriculture, University of Tennessee
DR. HARWOOD D. SCHAFFER: Research Assistant Professor at APAC, University of Tennessee
|
|