Midseason Nitrogen Management With On-The-Go Sensors
Most cotton fields in the Delta region have several soil types with different textures and available water holding capacities. Cotton response to nitrogen fertilizer is dependent on soil physical properties, residual N, yield potential, rainfall, irrigation, and crop rotation. The economic optimum nitrogen rate for cotton production in one part of a field may be different from another area. To avoid yield losses in a deficient area, the tendency is to over-apply N in the rest of the field resulting in delayed maturity and need for plant growth regulators. Tissue testing cotton plants is a good tool for making mid-season N decisions but is labor intensive and expensive when many samples are collected. “On-the-go” equipment-mounted sensors are a new precision agriculture technology which can be used to fine tune nitrogen applications on cotton. Commercial scale machinery that can accurately vary N rates on-the-go based on the leaf color reflectance is now available. The beauty of mounting sensors on application equipment is that there is no time delay between detecting N deficiency and fertilizer application to correct the problem. Field calibration research is needed to find nitrogen fertilizer response algorithms for the technologies. Algorithms are used to prescribe the minimum N needed to allow the cotton to reach its maximum economical yield potential.
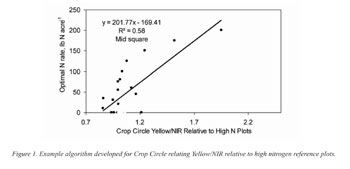
A research project was begun at Portageville, Missouri in 2006 to provide cotton growers with information on using GreenSeeker TM, Crop Circle TM, and CropScan TM equipment-mounted sensors for applying nitrogen in cotton on silt loam, sandy loam, and clay soils. The primary focus of field work in 2006 and 2007 was to develop algorithms for each sensor, determine the optimum height for placing sensors above the cotton canopy, and evaluate the accuracy of using sensors for N management at different cotton growth stages, times of day, and levels of leaf wetness (Figure 1). In 2008 and 2009, we conducted field tests evaluating the yield impact of delaying the first application of N to mid-square and first bloom. We also conducted an on-farm sensor evaluation in Southeast Missouri comparing a farmer’s standard side-dress rate in alternate strips with variable rate N applied based on algorithms developed from 2006-2007 small plot calibration research.
In small plot tests, sensor measurements were collected in 10-day intervals from mid-June to late- August. A high-clearance tractor with multi-spectral sensors mounted on a boom was driven through all plots. Data loggers in the tractor cab recorded cotton leaf reflectance data collected from Crop Circle Model ACS-210 (Holland Scientific; Lincoln, NE), GreenSeeker (N Tech Industries; Stillwater, OK) and CropScan MSR87 (CropScan; Rochester, MN). In 2008, we also collect height with an experimental ultrasound sensor. At each sampling date, leaf chlorophyll meter readings from the fourth node from the apex were collected with a SPAD-502 meter (Minolta Camera Co, LTD.; Tokyo, Japan) and petiole NO3- concentration also from fourth node.

In 2006, we found the economically optimal N rate (EONR) was 60 lb N acre-1 on sandy loam, 0 lb N acre-1 on silt loam, and 200 lb N acre-1 on clay. In 2007, the EONR was 45 lb N acre-1 on sandy loam, 80 lb N acre-1 on silt loam, and 175 lb N acre-1 on clay. We found that mounting sensor 20 inches above the canopy worked best, calibration equations at mid square and first flower were not significantly different, and Normalized Difference Vegetation Index (NDVI) and the ratio of visible and near infrared reflectance (VIS/NIR) worked equally well. Although each of the three sensors performed well, we recommend using an adjustment equation with Greenseeker to compensate for deviations in time of day. Cotton yields in 2008 were lower when first N application was delayed to early flower. In the on-farm test in 2008, strips with N applied based on Crop Circle readings averaged 46 lb N acre-1 less fertilizer compared to the grower rate. Readings from a picker yield monitor indicated average lint yields were 1138 lb lint acre-1 in strips with variable rate N applied and 1209 lb lint acre-1 with the grower N rate.
All three sensor models gave good predictions of N need in the analyses at a height of 20 inches above the canopy. N rate recommendations based on sensors were more reliable at the mid-square and early flower growth stage than at the early square growth stage. Funding for this research was provided by Cotton Incorporated and the Missouri State Support Committee. Δ